Today on Fox Business Varney & Company, David Bahnsen (The Bahnsen Group) was asked if the current market reminded him of the Dot.com Bubble. He said it did, but not the part about all those worthless dot.com companies that went bust. Big companies like Cisco, Microsoft, and Intel also had parabolic up moves, then they had parabolic breakdowns from which it took years to recover.
In the dot.com bubble there was a belief that companies with a pile of web pages were going to make a pile of money. Currently, there is a frenzy that is derived from unrealistic expectations regarding AI. Yes, AI will be successful, but the specifics have yet to be seen, and there is a hint of Tulip Mania in the air.
We don’t know how it will eventually play out, but there will eventually be a bear market, and we will see those so-called “bullet proof” stocks get shot full of holes. To demonstrate what can happen, lets look at what happened to the stocks of some solid companies during the Dot.com bust. Just to be clear, I lived through those days, and I can say that today has a very similar look and feel. Yes, 9-11 contributed to the decline, but most of the damage had been done before then.
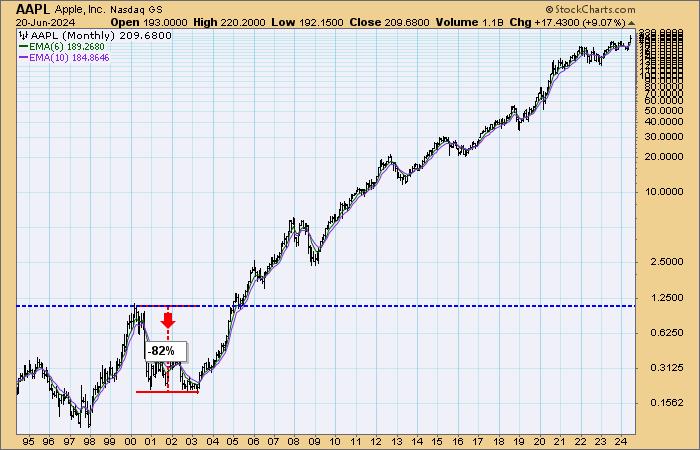
In 2000 pre-iPhone Apple was not the company it is today, but it was a solid company. It lost -82% and it was five years before it returned to its 2000 high.
Amazon was still a book store. It fell -95% and took 10 years to recover.
Cisco was one of the biggies in 2000, and it fell -90% and took 22 years to recover.
Intel was another favorite back in the day. It fell -83% and took 18 years to recover.
If any of these stocks was bullet proof it was Microsoft. It fell a meager -67% and took 15 years to recover.
Finally, Oracle fell -85% and took 14 years to recover.
CONCLUSION: We do not know how or when the inevitable “adjustment” will materialize, but we think it is bound to happen, because it always, always, always does. We do not mean to imply that there will be losses similar to 2000-2002. But there is the history. Will we learn from it?
Learn more about DecisionPoint.com:
Watch the latest episode of the DecisionPointTrading Room on DP’s YouTube channel here!
Try us out for two weeks with a trial subscription!
Use coupon code: DPTRIAL2 at checkout!
Technical Analysis is a windsock, not a crystal ball. –Carl Swenlin
(c) Copyright 2024 DecisionPoint.com
Disclaimer: This blog is for educational purposes only and should not be construed as financial advice. The ideas and strategies should never be used without first assessing your own personal and financial situation, or without consulting a financial professional. Any opinions expressed herein are solely those of the author, and do not in any way represent the views or opinions of any other person or entity.
DecisionPoint is not a registered investment advisor. Investment and trading decisions are solely your responsibility. DecisionPoint newsletters, blogs or website materials should NOT be interpreted as a recommendation or solicitation to buy or sell any security or to take any specific action.
Helpful DecisionPoint Links:
Price Momentum Oscillator (PMO)


