


I was asked recently about volume, specifically why I don’t feature volume often on my daily market recap show, CHART THIS with David Keller, CMT. I replied that when I was learning the technical analysis toolkit earlier in my career, I very much paid attention to volume indicators.
But in the years to follow, I developed a process that focused more on trend and momentum, and I felt the approach worked quite well despite the lack of volume inputs. But there is one indicator that has been fairly successful at recognizing market turns over the last year, and it’s a chart I will be following closely in the weeks to come.
Volume to Chaikin Money Flow
First, let’s talk about how we measure volume over time. The easiest way to represent volume is with the daily volume bars, helping us determine if today’s volume is above or below average. And while that can be helpful for navigating the short-term environment, it doesn’t help us assess how volume is evolving over time.
Famous strategist Joe Granville developed the concept of “On Balance Volume” where he created a cumulative total of volume by adding up days’ volume and subtracting down days’ volume. Similar to an advance-decline line, it does help to indicate the general directional trend in volume.
The issue here is that we’re taking an entire day’s volume and considering it all bullish or all bearish, depending on whether the close was higher than yesterday. What about if we finished at the high or the low of the day. Shouldn’t that matter in some way?
An Advance-Decline Line for Volume
Another legendary technician, Marc Chaikin, improved on Granville’s work by looking at every day’s price bar. If the close was closer to the high, then that day’s volume should be worth more in the running total. And if the close was near the middle of the range, that day’s volume should be worth less in the calculation.
Now we can see the running total of daily volume, but with more value given to the days with highs near the high or low for the day. So big up days and down days become much more important when we consider the overall trend in volume.
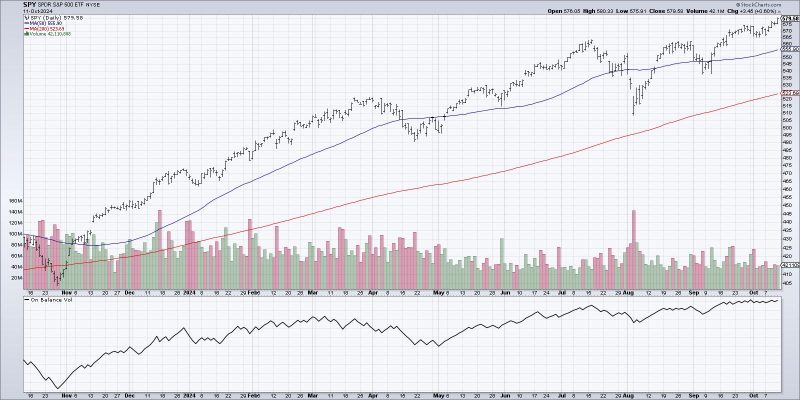
When the indicator is above zero it’s shaded green, and long-term uptrends often feature extended periods of green. When the indicator is below zero, represented with the red shading, this suggests a period of distribution as the down volume appears heavier.
Watching for Volume Divergences
While crossing below the zero line would represent a general rotation in volume from more accumulation to distribution, the real benefit of this indicator is in the early warning sign based on divergence.
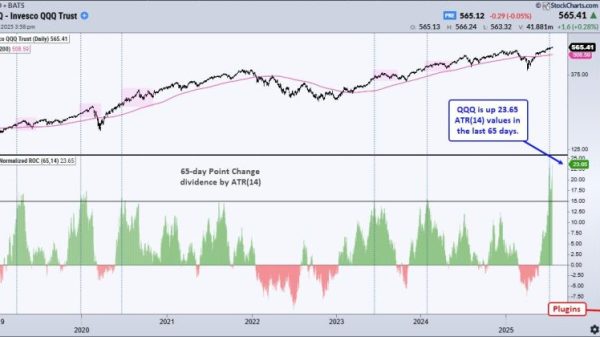
As the market was moving higher in July 2023 into the eventual August high, we saw a decline in the Chaikin Money Flow. We observed a similar pattern in March 2024, as the SPY pushed higher even as the CMF was trending lower, as well as in July 2024.
Notice how the current reading shows the Chaikin Money Flow reading as still quite strong for the S&P 500? This suggests that the market is still in a position of strength, given the stronger bullish volume in recent weeks. But this chart also tells us to keep a wary eye on the CMF in the coming weeks. Because a bearish divergence here could provide an early warning sign to mindful investors staying attuned to the rhythm of the markets.
Heads up! We just launched our new podcast, Market Misbehavior with David Keller, CMT, in October! Check out our recent interviews with Mark Newton, Joe Rabil, Mish Schneider, and Mike Livingston. Lots more great conversations coming your way very soon!
RR#6,
Dave
PS- Ready to upgrade your investment process? Check out my free behavioral investing course!
David Keller, CMT
President and Chief Strategist
Sierra Alpha Research LLC
Disclaimer: This blog is for educational purposes only and should not be construed as financial advice. The ideas and strategies should never be used without first assessing your own personal and financial situation, or without consulting a financial professional.
The author does not have a position in mentioned securities at the time of publication. Any opinions expressed herein are solely those of the author and do not in any way represent the views or opinions of any other person or entity.