


Is the stock market on the verge of crashing or has it bottomed?
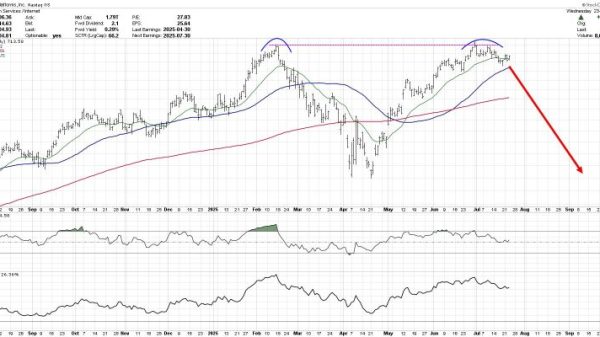
In this video, Joe Rabil uses moving averages and Fibonacci retracement levels on a longer-term chart of the S&P 500 to identify support levels that could serve as potential bottoms for the current market correction.
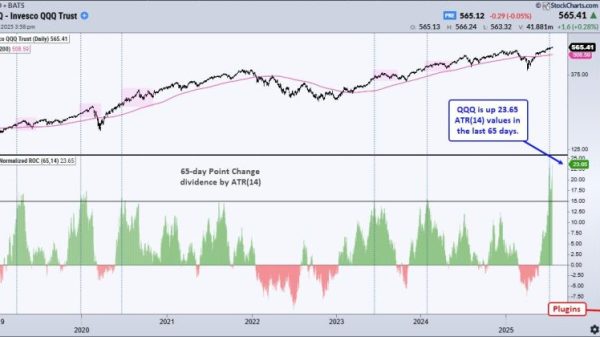
Understand why the 2025 stock market is different from the 2022 one and explore how the market drop can impact the SPY, QQQ, DIA, and IWM.
The video premiered on April 9, 2025. Click this link to watch on Joe’s dedicated page.
Archived videos from Joe are available at this link. Send symbol requests to stocktalk@stockcharts.com; you can also submit a request in the comments section below the video on YouTube. Symbol Requests can be sent in throughout the week prior to the next show.