


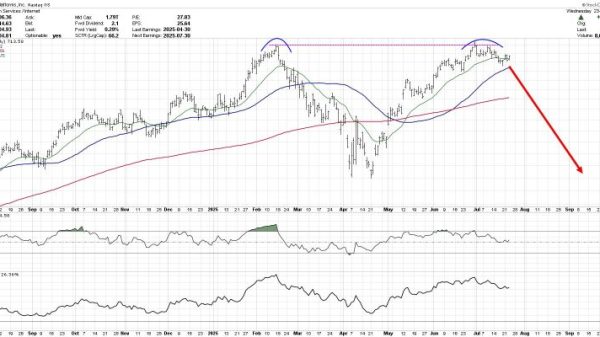


Five Below, Inc. (FIVE) has had a rough year, to say the least. The stock is trading near its 52-week lows and 65% below its 52-week highs. The company’s CEO resigned last July and, since then, shares have struggled to rebound.
The discount retailer that caters to low-income shoppers rallied 10% after last quarter’s results and quickly gave back all those gains. It’s hoping to follow in the footsteps of its peer, Dollar General (DG), which guided higher than expectations and rallied last week.
Technically, shares are in a long-term downtrend that has accelerated headed into this week’s numbers. Every rally has been an opportunity to sell, as shares have consistently trended below its downward-sloping 200-day simple moving average (SMA).
Shares are oversold based on their relative strength index (RSI), but the stock has remained oversold for weeks. It appears closer to a tradable near-term bottom, where there is support for a bigger sell-off to around $65.
As a result of this, risk/reward favors the bulls. Look for shares to rally back into the downtrend channel on a near-term rally. That would take shares into the $78 to $85 area. Sadly, each rally has been a great opportunity to sell. There is much resistance to get through any upswing to signal that this is a good long-term buy, but, for the swing trader, a rally may be in order.
Nike, Inc. (NKE) shares have been mired in a two-year slump. Shares have fallen after the last five quarterly reports with an average loss of -9%. They have traded lower after seven of the last 8 releases. Shareholders are hoping that the second full quarter under CEO Elliot Hill’s leadership will start the much-needed turnaround for investors.
The sneaker giant expects slower sales and a decline in numbers thanks to markdowns to clear out unpopular inventory. However, hope springs eternal. Have new shoe models grown in popularity? Has Mr. Hill started to stem the tide of weaker growth? We shall find out when they report after the close on Thursday.
Technically, since breaking below the 200-day moving average in December 2023, shares have consistently stayed below this key moving average. There was hope that a recent announcement with Kim Kardashian’s Skims could lead to the breakout. It did lift for a couple of days, but couldn’t sustain upward momentum, so the bears won out again.
There is a small silver lining in the chart above, though. When shares hit a recent low, the RSI reading had a bullish divergence. This means price made a new low, but the momentum indicator made a higher low. This could be a change demonstrating that the worst may be over.
To the upside, expect a test with that pesky 200-day moving average again. Look for a break above there and a run to recent highs at $82.62. If it fails at that level, you want to see old resistance in the 200-day act as support. Then the bulls may be able to take control. To the downside, you do not want to see any new lows, Look for support at the $68 to $70 level. The risk/reward set-up favors the bulls taking a shot here and keeping sell stops nearby if it fails.
Micron Technology, Inc. (MU) has experienced some rather large moves after reporting earnings over the last four quarters. Last Q, it dropped -16.2%; before that, it gained +14.7%, lost -7.1%, and rallied +14.1%. So it’s not surprising to see that a move of +/-10.4% is expected when it reports after the close on Thursday.
Investors will focus on a few fundamental stories. Projected gross margins might decline according to their guidance. That could be a headwind. Data center revenue has been a strength; let’s see if it continues. Then, of course, there’s the all-important guidance—will they mention demand metrics and address potential tariff concerns?
Technically, shares continue to be mired in a neutral, yet very tradable, range. Going back to its August lows, shares have found a solid level of support around $85. Shares have tested that level multiple times and held. On the first three occasions, shares rallied back to $110. Recently, they have struggled to get that high, and the downward sloping 200-day now acts as resistance.
If shares were to gap higher, watch two strong levels of resistance. The first is the 200-day at $105.20, while the second, and most important, is just above $110 to $114. It may take a miraculous guide to break and stay above these key resistance levels.
As to the downside, we have seen $85 stand the test of time again and again. The more often it is tested, the more likely it is to fail. So there are clear lines in the sand of this rectangular formation. The measured move from this pattern is for a move of +/- $25. That would give upside and downside targets of $135 and $60, respectively. Clearly, it’s a coin flip at the moment from a risk/reward perspective. We will need more information to see how this resolves. For now, keep trading the channel.
Disclaimer: This blog is for educational purposes only and should not be construed as financial advice. The ideas and strategies should never be used without first assessing your own personal and financial situation, or without consulting a financial professional.