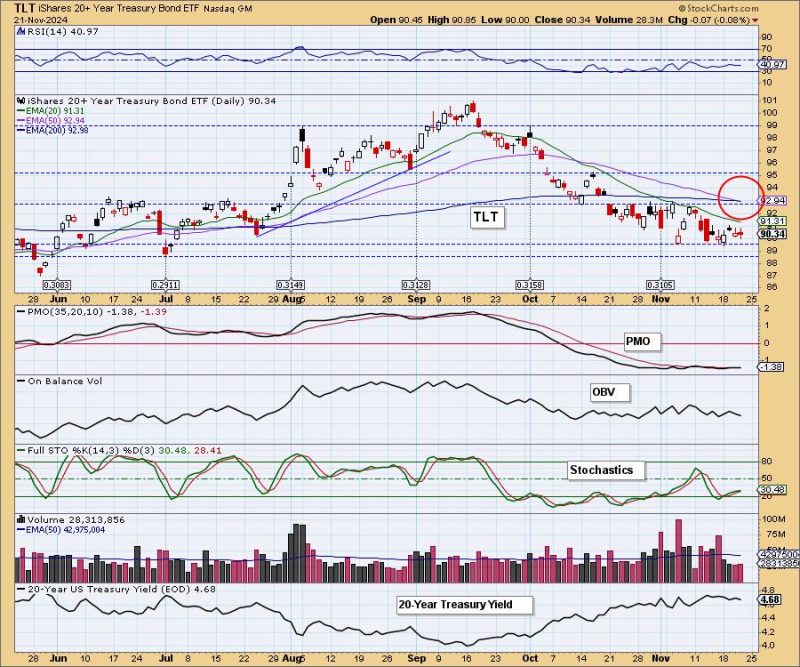
Today the 20-Year Bond ETF (TLT) 50-day EMA crossed down through the 200-day EMA (Death Cross), generating an LT Trend Model SELL Signal. This was the result of a down trend lasting over two months. We note that the PMO has been running flat below the zero line for a month, which tells us that steady downward pressure has been applied to price.
On the weekly chart we observe a bullish reverse head and shoulders pattern, which executed when price broke above the neckline and rallied for a couple of weeks. Next it performed a technical pullback to the support line. If the support fails, the pattern will abort, and we will assume a bearish outlook in this time frame.
We have been watching this 46-year monthly chart of the 30-Year Bond for a few years now. An extremely long-term (40-year) rising trend line was violated in 2022. At the time we asserted that bonds had turned bearish and that condition would most likely persist for many years. We have not changed our outlook. There may be encouraging rallies from time to time, but we believe they will fail.
Conclusion: The LT Trend Model SELL Signal was triggered by a persistent two-month decline. In the longer-term, bonds appear to be attempting a rally. Our outlook is bearish, but we need to see how far the rally can go. In any case, we believe the ultimate outcome will be bearish.
Introducing the new Scan Alert System!
Delivered to your email box at the end of the market day. You’ll get the results of our proprietary scans that Erin uses to pick her “Diamonds in the Rough” for the DecisionPoint Diamonds Report. Get all of the results and see which ones you like best! Only $29/month! Or, use our free trial to try it out for two weeks using coupon code: DPTRIAL2. Click HERE to subscribe NOW!
Learn more about DecisionPoint.com:
Watch the latest episode of the DecisionPointTrading Room on DP’s YouTube channel here!
Try us out for two weeks with a trial subscription!
Use coupon code: DPTRIAL2 Subscribe HERE!
Technical Analysis is a windsock, not a crystal ball. –Carl Swenlin
(c) Copyright 2024 DecisionPoint.com
Disclaimer: This blog is for educational purposes only and should not be construed as financial advice. The ideas and strategies should never be used without first assessing your own personal and financial situation, or without consulting a financial professional. Any opinions expressed herein are solely those of the author, and do not in any way represent the views or opinions of any other person or entity.
DecisionPoint is not a registered investment advisor. Investment and trading decisions are solely your responsibility. DecisionPoint newsletters, blogs or website materials should NOT be interpreted as a recommendation or solicitation to buy or sell any security or to take any specific action.
Helpful DecisionPoint Links:
Price Momentum Oscillator (PMO)
Swenlin Trading Oscillators (STO-B and STO-V)
D


