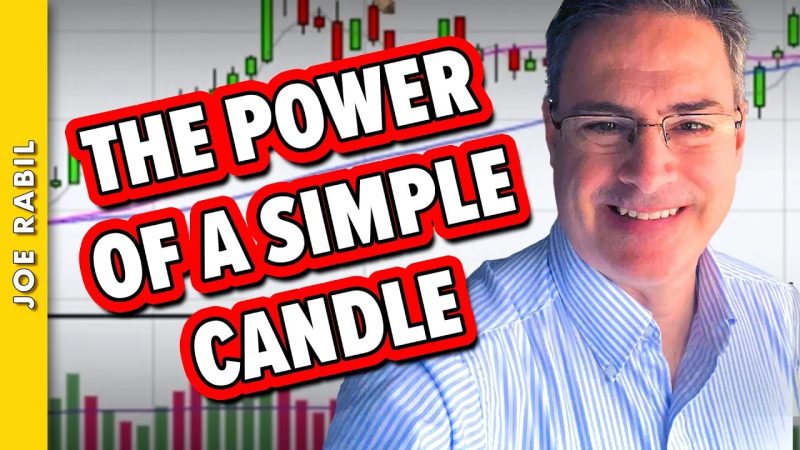
In this exclusive StockCharts video, Joe shows a specific candlestick pattern that, when it develops at the right time, can signal the start of a new upleg. He uses NVDA, MSFT and GLD to explain how this can setup at different times and can give a timely signal to look to enter or in some cases a signal to exit. Joe then covers TNX and some commodities like Silver, Oil and Copper. Finally, he goes through the symbol requests that came through this week, including GOOGL, GBTC, and more.
This video was originally published on October 30, 2024. Click this link to watch on StockCharts TV.
Archived videos from Joe are available at this link. Send symbol requests to stocktalk@stockcharts.com; you can also submit a request in the comments section below the video on YouTube. Symbol Requests can be sent in throughout the week prior to the next show.


