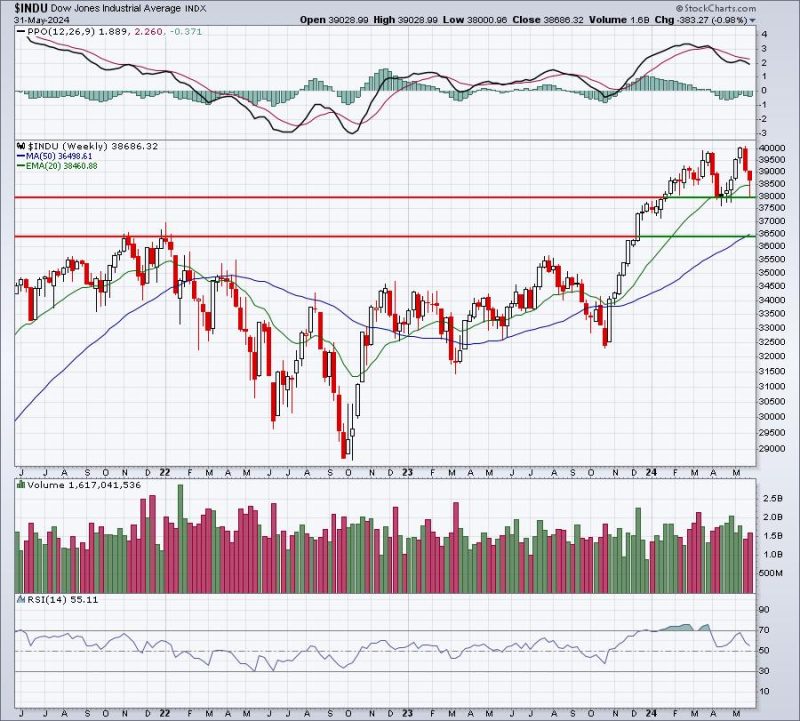
I’m all for a big rally with a hammer printing on the long-term weekly chart, especially at 20-week EMA support. That’s exactly what happened on Friday on the Dow Jones Industrial Average ($INDU). This index of conglomerates had been underperforming other areas of the stock market badly and, on Friday, was on the verge of printing its lowest weekly close since back in January. The April low weekly close was 37983.24 and Friday’s low was 38000.96. So after posting an all-time high weekly (and daily) close at 40003.59 just two weeks ago, the Dow Jones was on the verge of moving to a close that wasn’t too far from a 2024 low weekly close.
Then the buying happened:
During secular bull market advances, it’s important to hold onto 20-week EMA support and the Dow did just that. The Dow climbed over 300 points in the last 20 minutes. It was a fantastic finish.
So what’s not to like about it? What’s the opposite of a “silver lining?” Maybe “every rose has its thorn?”
Well, here’s the thorn:
That bottom panel shows that, while the overall market made a HUGE reversal, with the S&P 500 climbing all the way back to where it was early in the week, the XLK lagged WAY behind on a relative basis. Rotation is a part of the game and sometimes, even during solid bull markets, we’ll see money rotate away from technology. But let’s keep one thing in mind. Technology (XLK) represents 29.2% of the S&P 500. Technology represents 49.29% of the NASDAQ 100 ($NDX), while representing just 18.6% of the Dow Jones.
My point here is that if we’re witnessing rotation away from technology, even for just a brief period of time, we should expect to see outperformance of areas without as much technology exposure – like the Dow Jones. And after seeing that Dow reversal off its 20-week EMA, I believe we’ll see the Dow Jones outperform during the month of June.
Join our EB Digest (EBD) newsletter today to enjoy other thought-provoking charts published 3x per week. Find out the sector that LOVES the month of June as I’ll be discussing that in Monday’s EBD. CLICK HERE to start your FREE subscription today!
Happy trading!
Tom


