


After sharp declines into mid April, stocks rebounded over the last three weeks and the S&P 500 SPDR (SPY) came within 1% of its March high. This March high acts as a benchmark high that chartists can use to compare performance. Stocks and ETFs trading above their March highs are leading and showing relative strength.
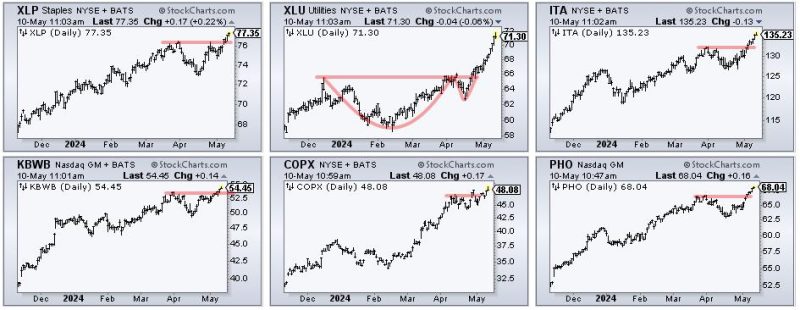
Current leaders include the Consumer Staples SPDR (XLP), Utilities SPDR (XLU), Aerospace & Defense ETF (ITA), KBW Bank ETF (KBWB), Copper Miners ETF (COPX), Infrastructure ETF (IFRA) and Water Resources ETF (PHO). The CandleGlance chart below shows all hitting new highs here in May. All six are also in clear uptrends.
The CandleGlance chart above shows XLU with a cup-with-handle breakout at 66 in late April. This signal was featured in ChartTrader on April 30th. Despite a strong extension on this breakout, XLU is a concern because it is trading some 13% above its 200-day SMA. The next chart shows XLU with the Percent Above MA (1,200,1) indicator. XLU was more than 13% above its 200-day SMA in February 2020 and April 2022 (dashed lines). This ETF is getting frothy and ripe for a correction. This indicator is part of the TIP Indicator-Edge Plugin for StockCharts ACP.
This week at TrendInvestorPro (ChartTrader) we featured tradable patterns in Vertex Pharma (VRTX), Union Pacific (UNP), the Home Construction ETF (ITB), Lennar (LEN) and CrowdStrike (CRWD). We continue to monitor short-term breadth during this rebound and update our 14 indicator Composite Breadth Model every Tuesday. Click here to learn more.
//////////////////////////////////////////////////